Research terminal
Asset Analysis combines a markets home with watchlists and news, deep charting and technical studies, regression and correlation, portfolio optimization, and company valuations. Subscribe for full access; preview each tool below to see what you get in the live terminal.
Continue with Google — quick sign-in when your server has Google OAuth configured.
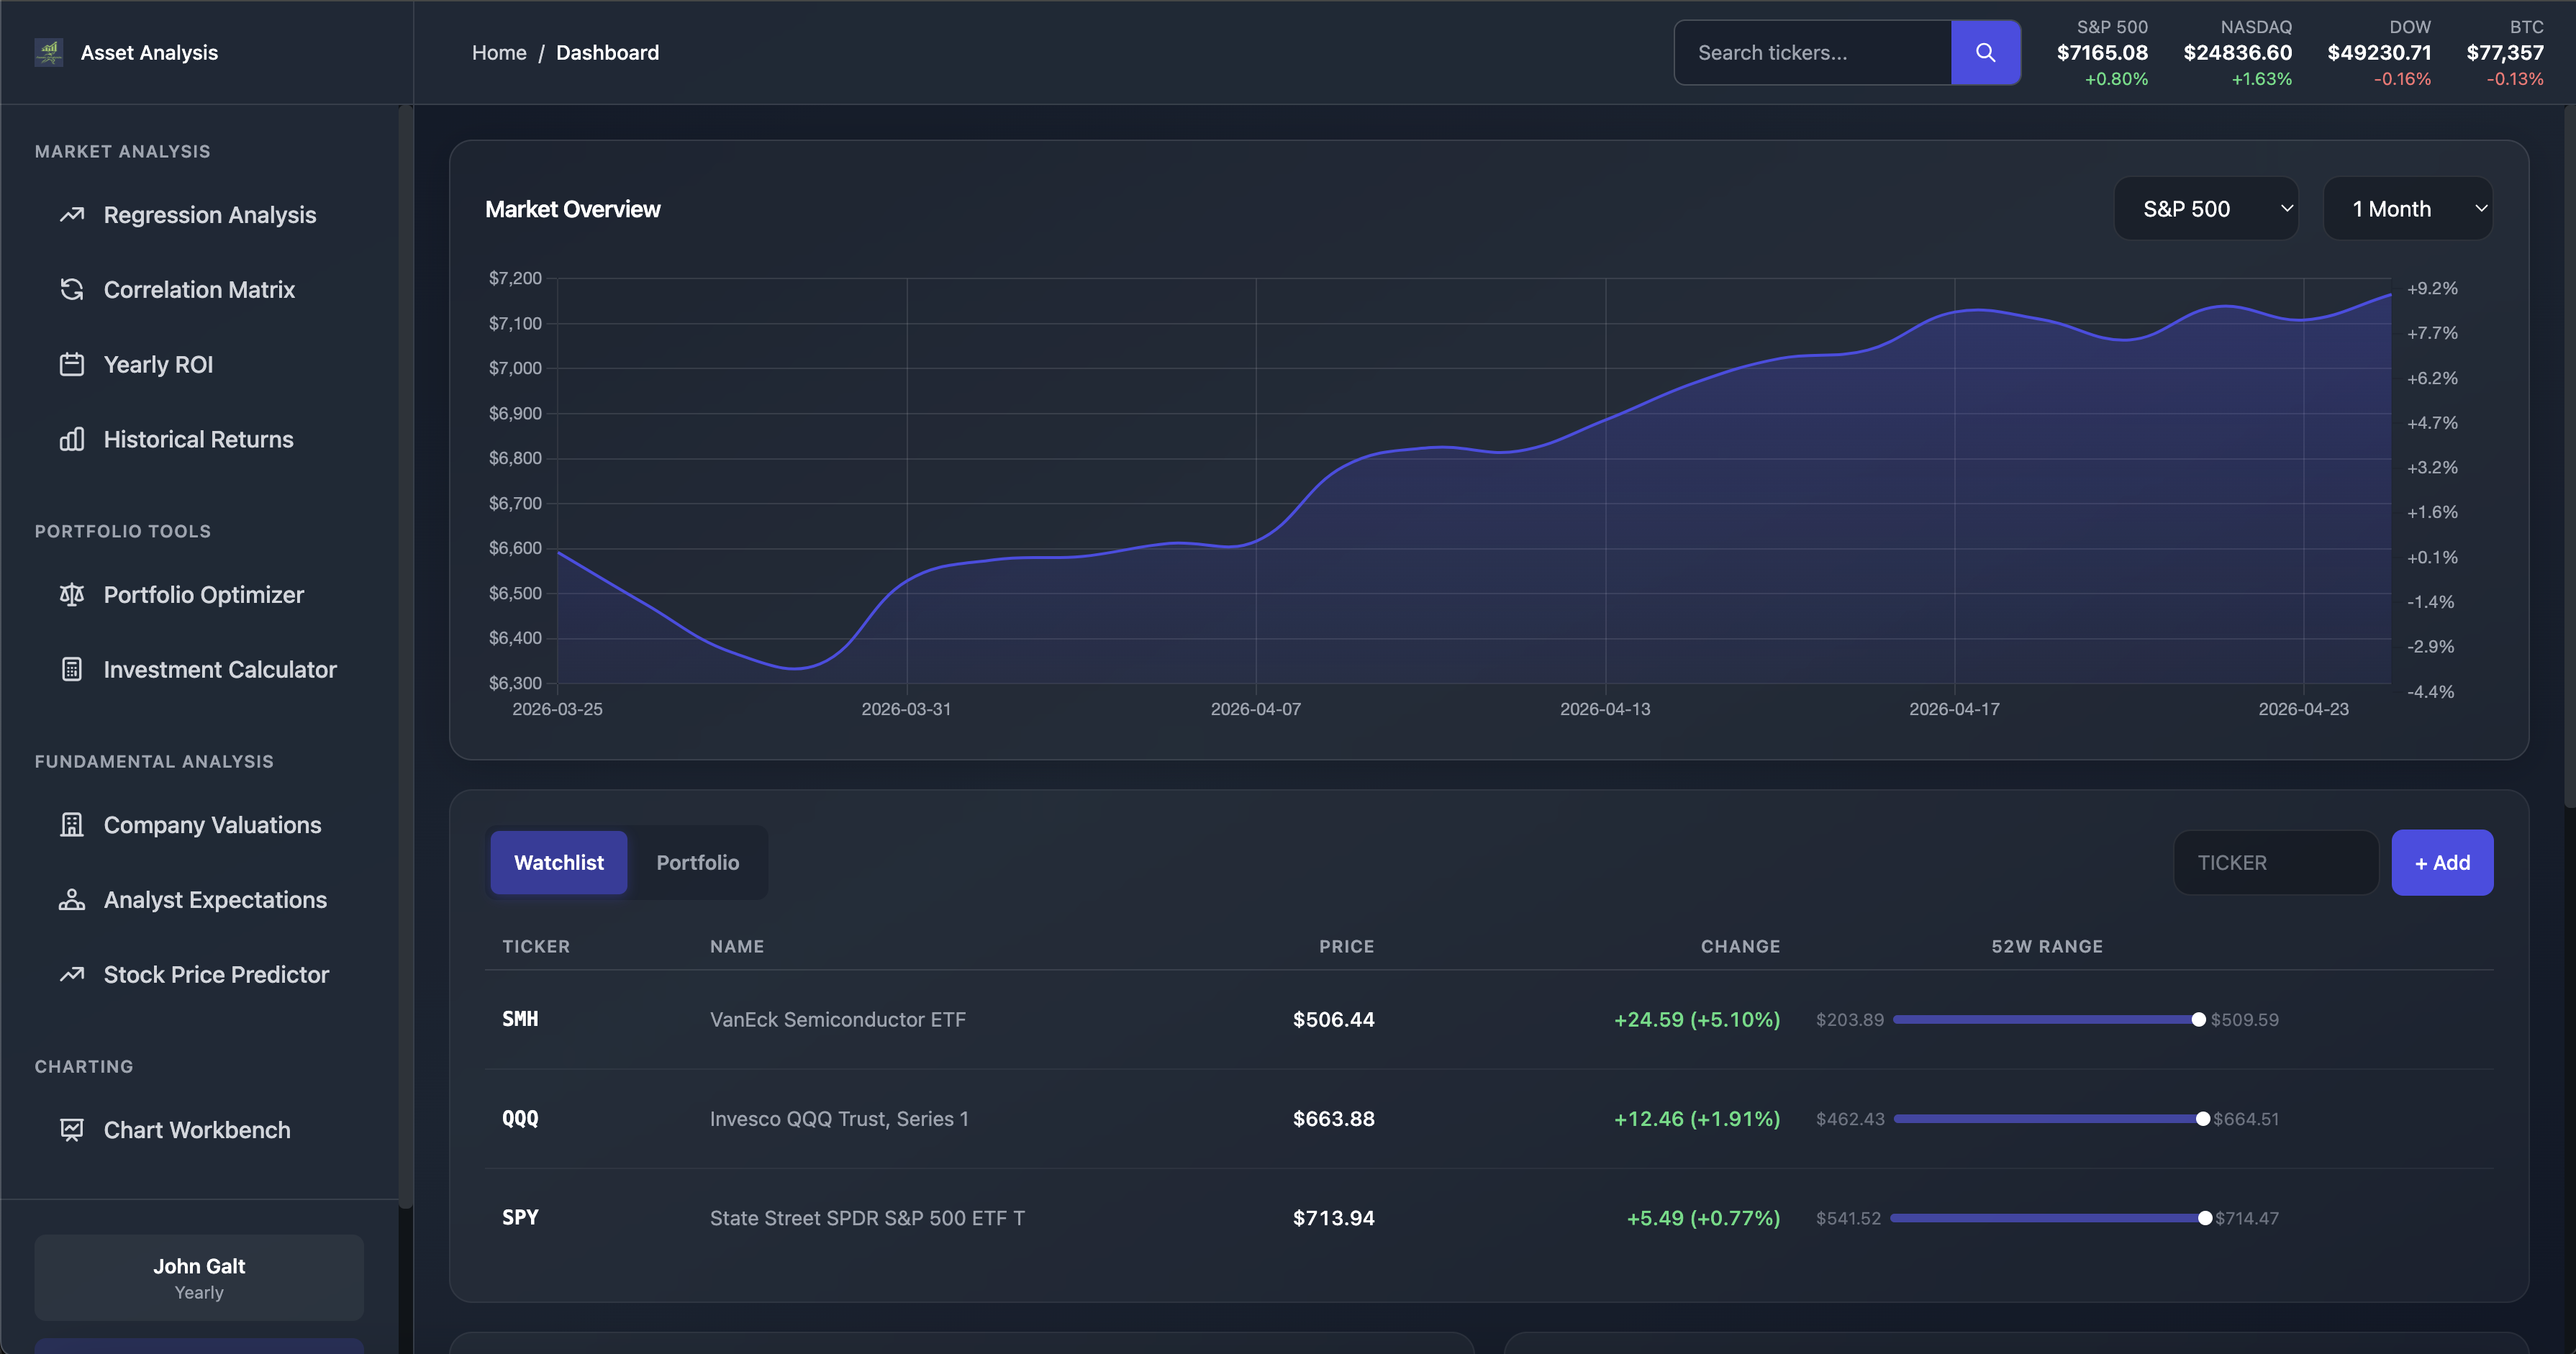
Market overview with live index chart, watchlist and portfolio tabs, movers, curated news, and an earnings calendar — the same shell you use after sign-in.
Open in app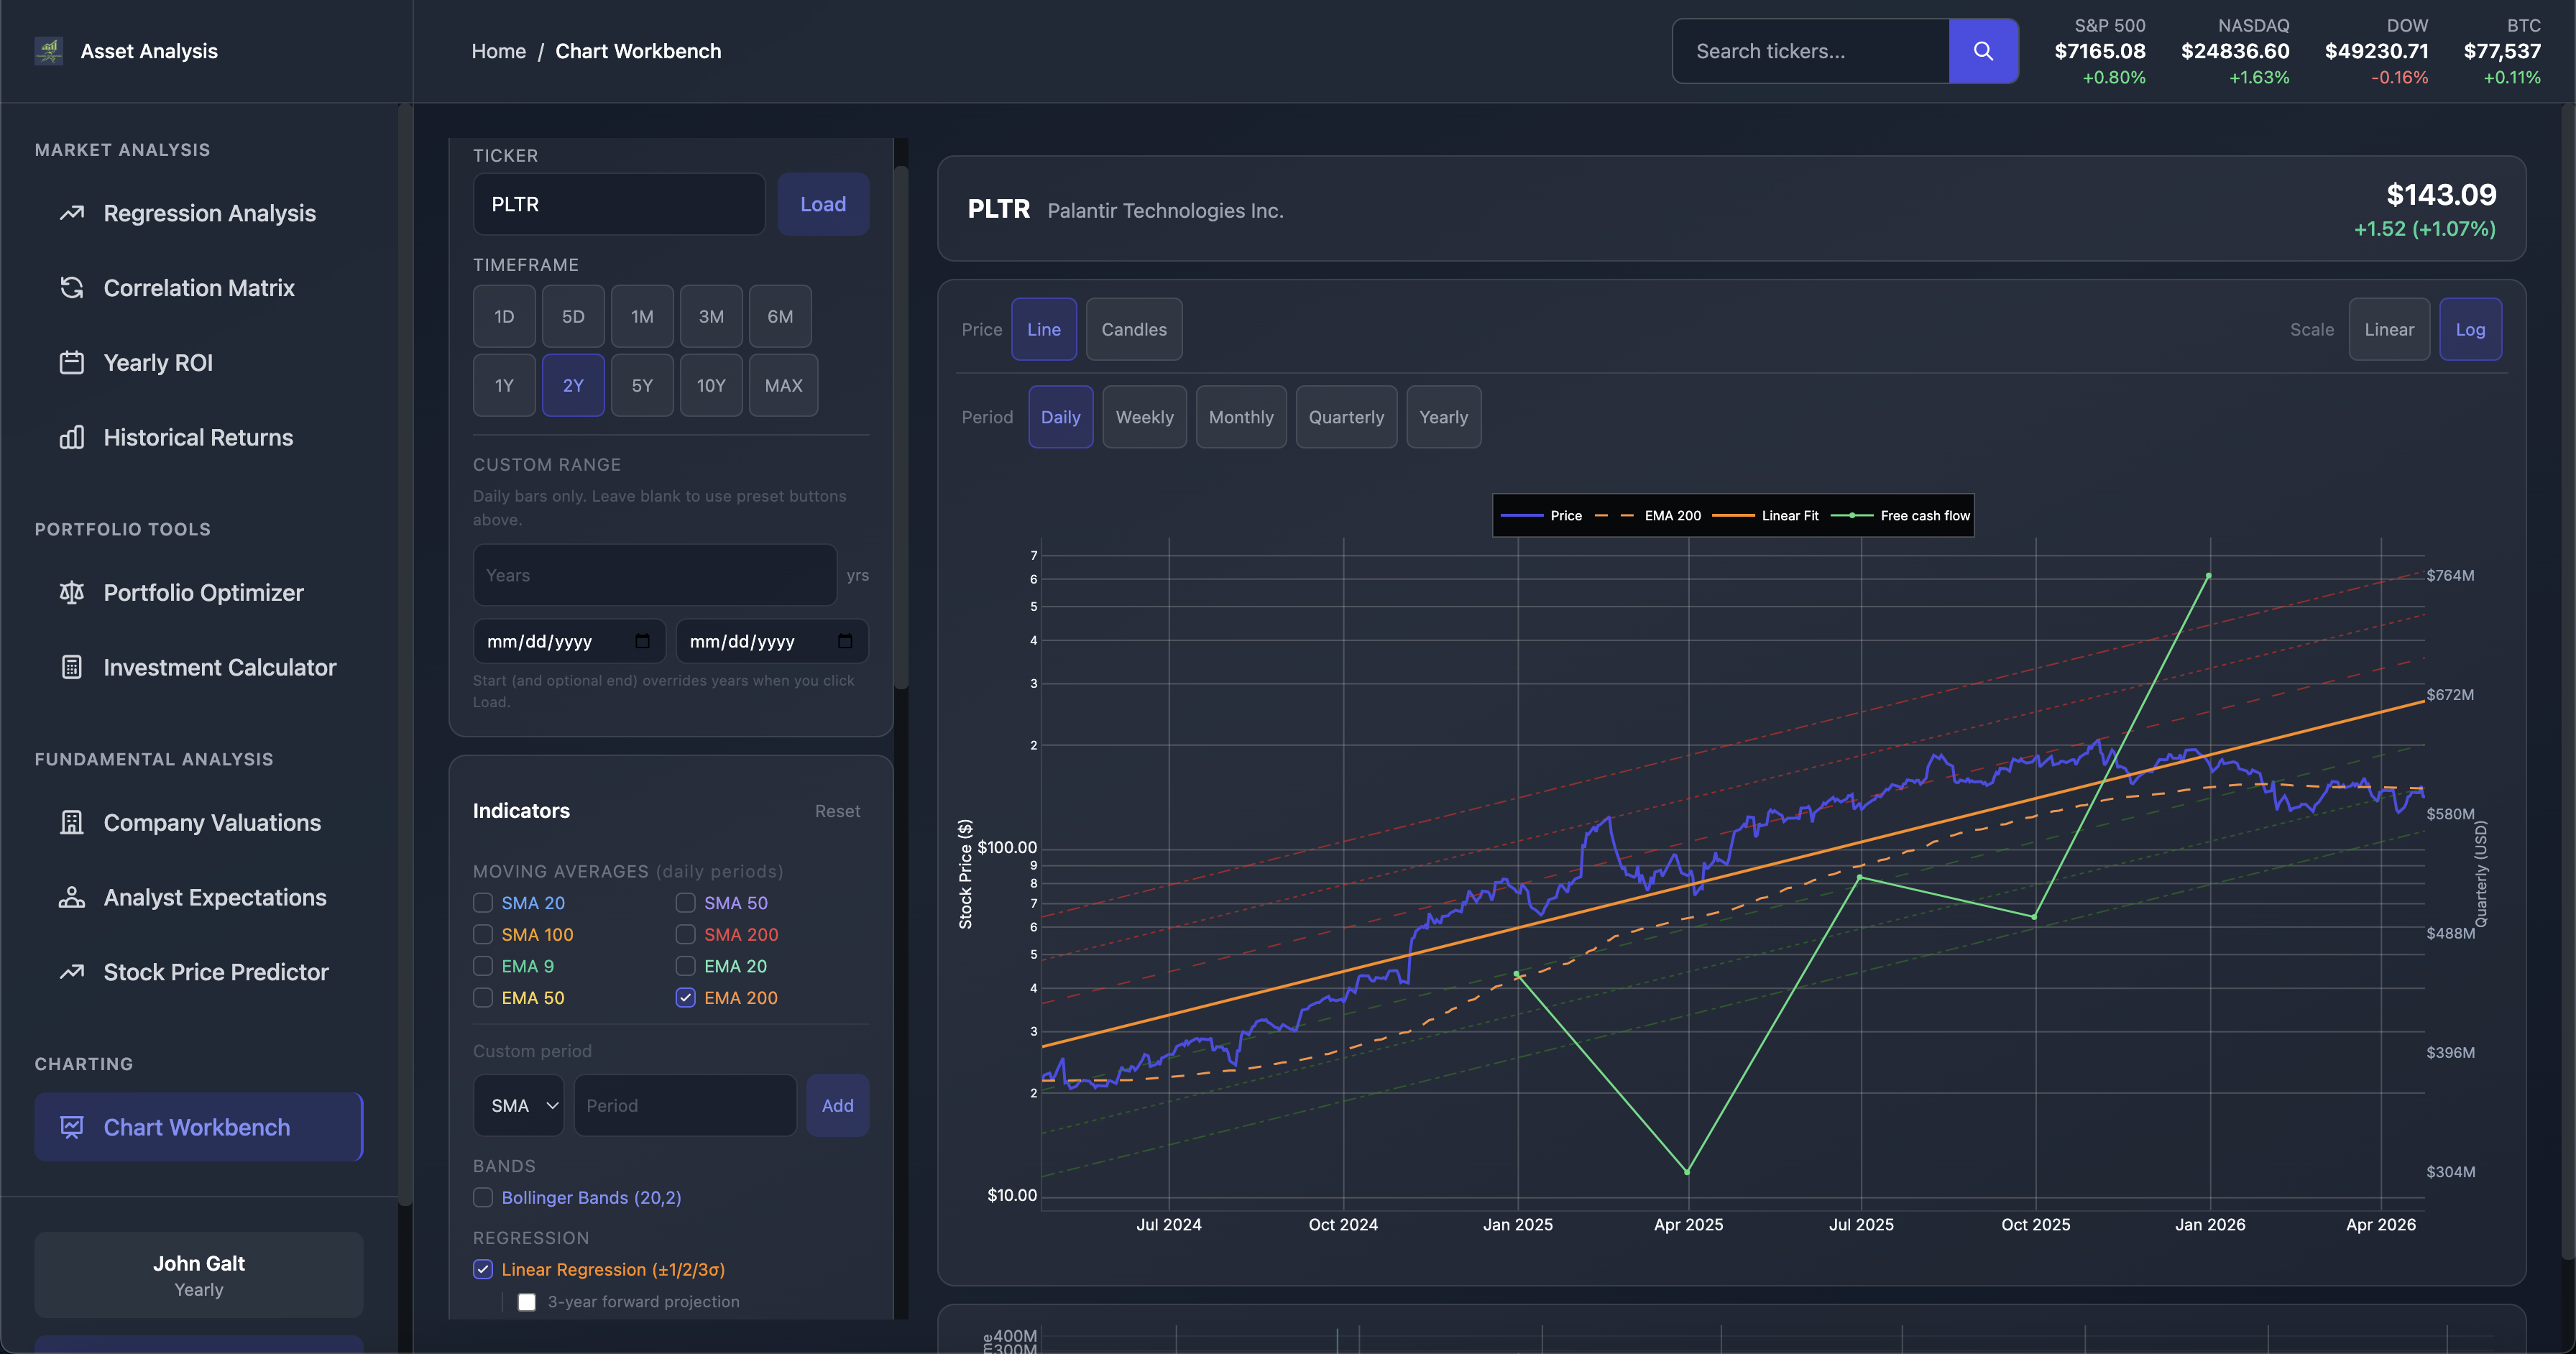
OHLCV charts with moving averages, Bollinger, RSI, MACD, log-regression bands, optional fundamentals overlay, saved layouts, and price alerts tied to your symbols.
Open chart workbench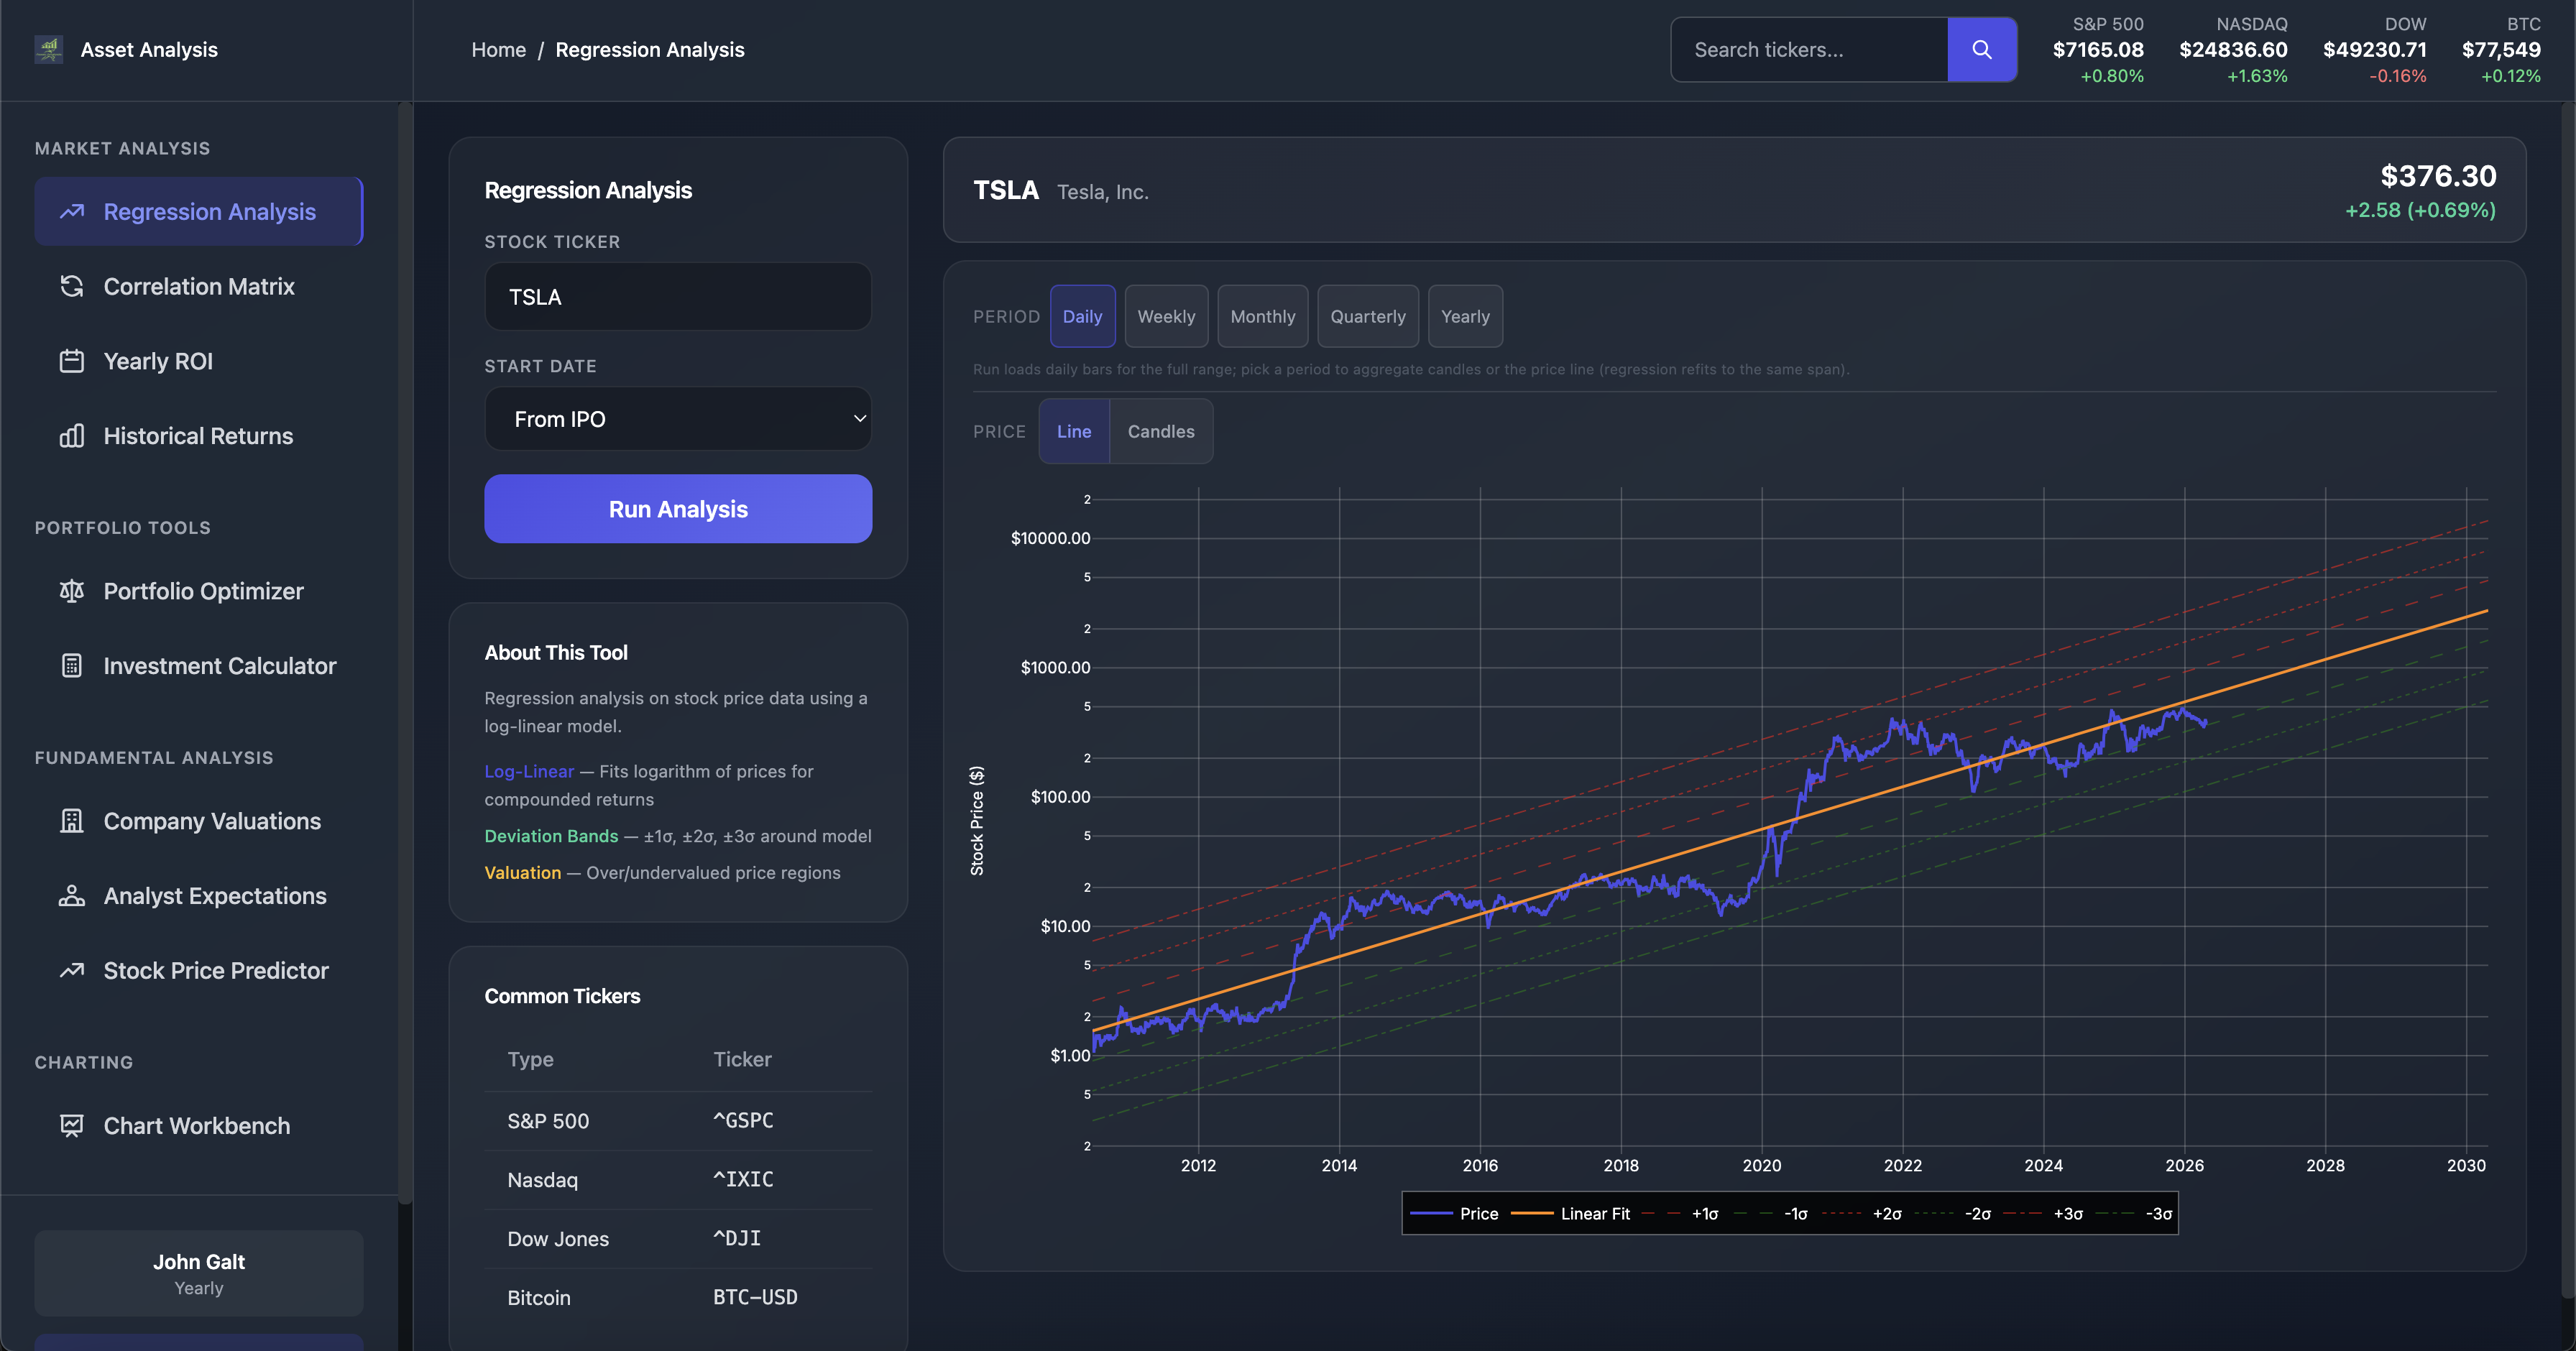
Log-linear fit on price history with optional daily / weekly / monthly / quarterly / yearly bars, σ-bands, and forward projection — built for long-horizon context.
Open regression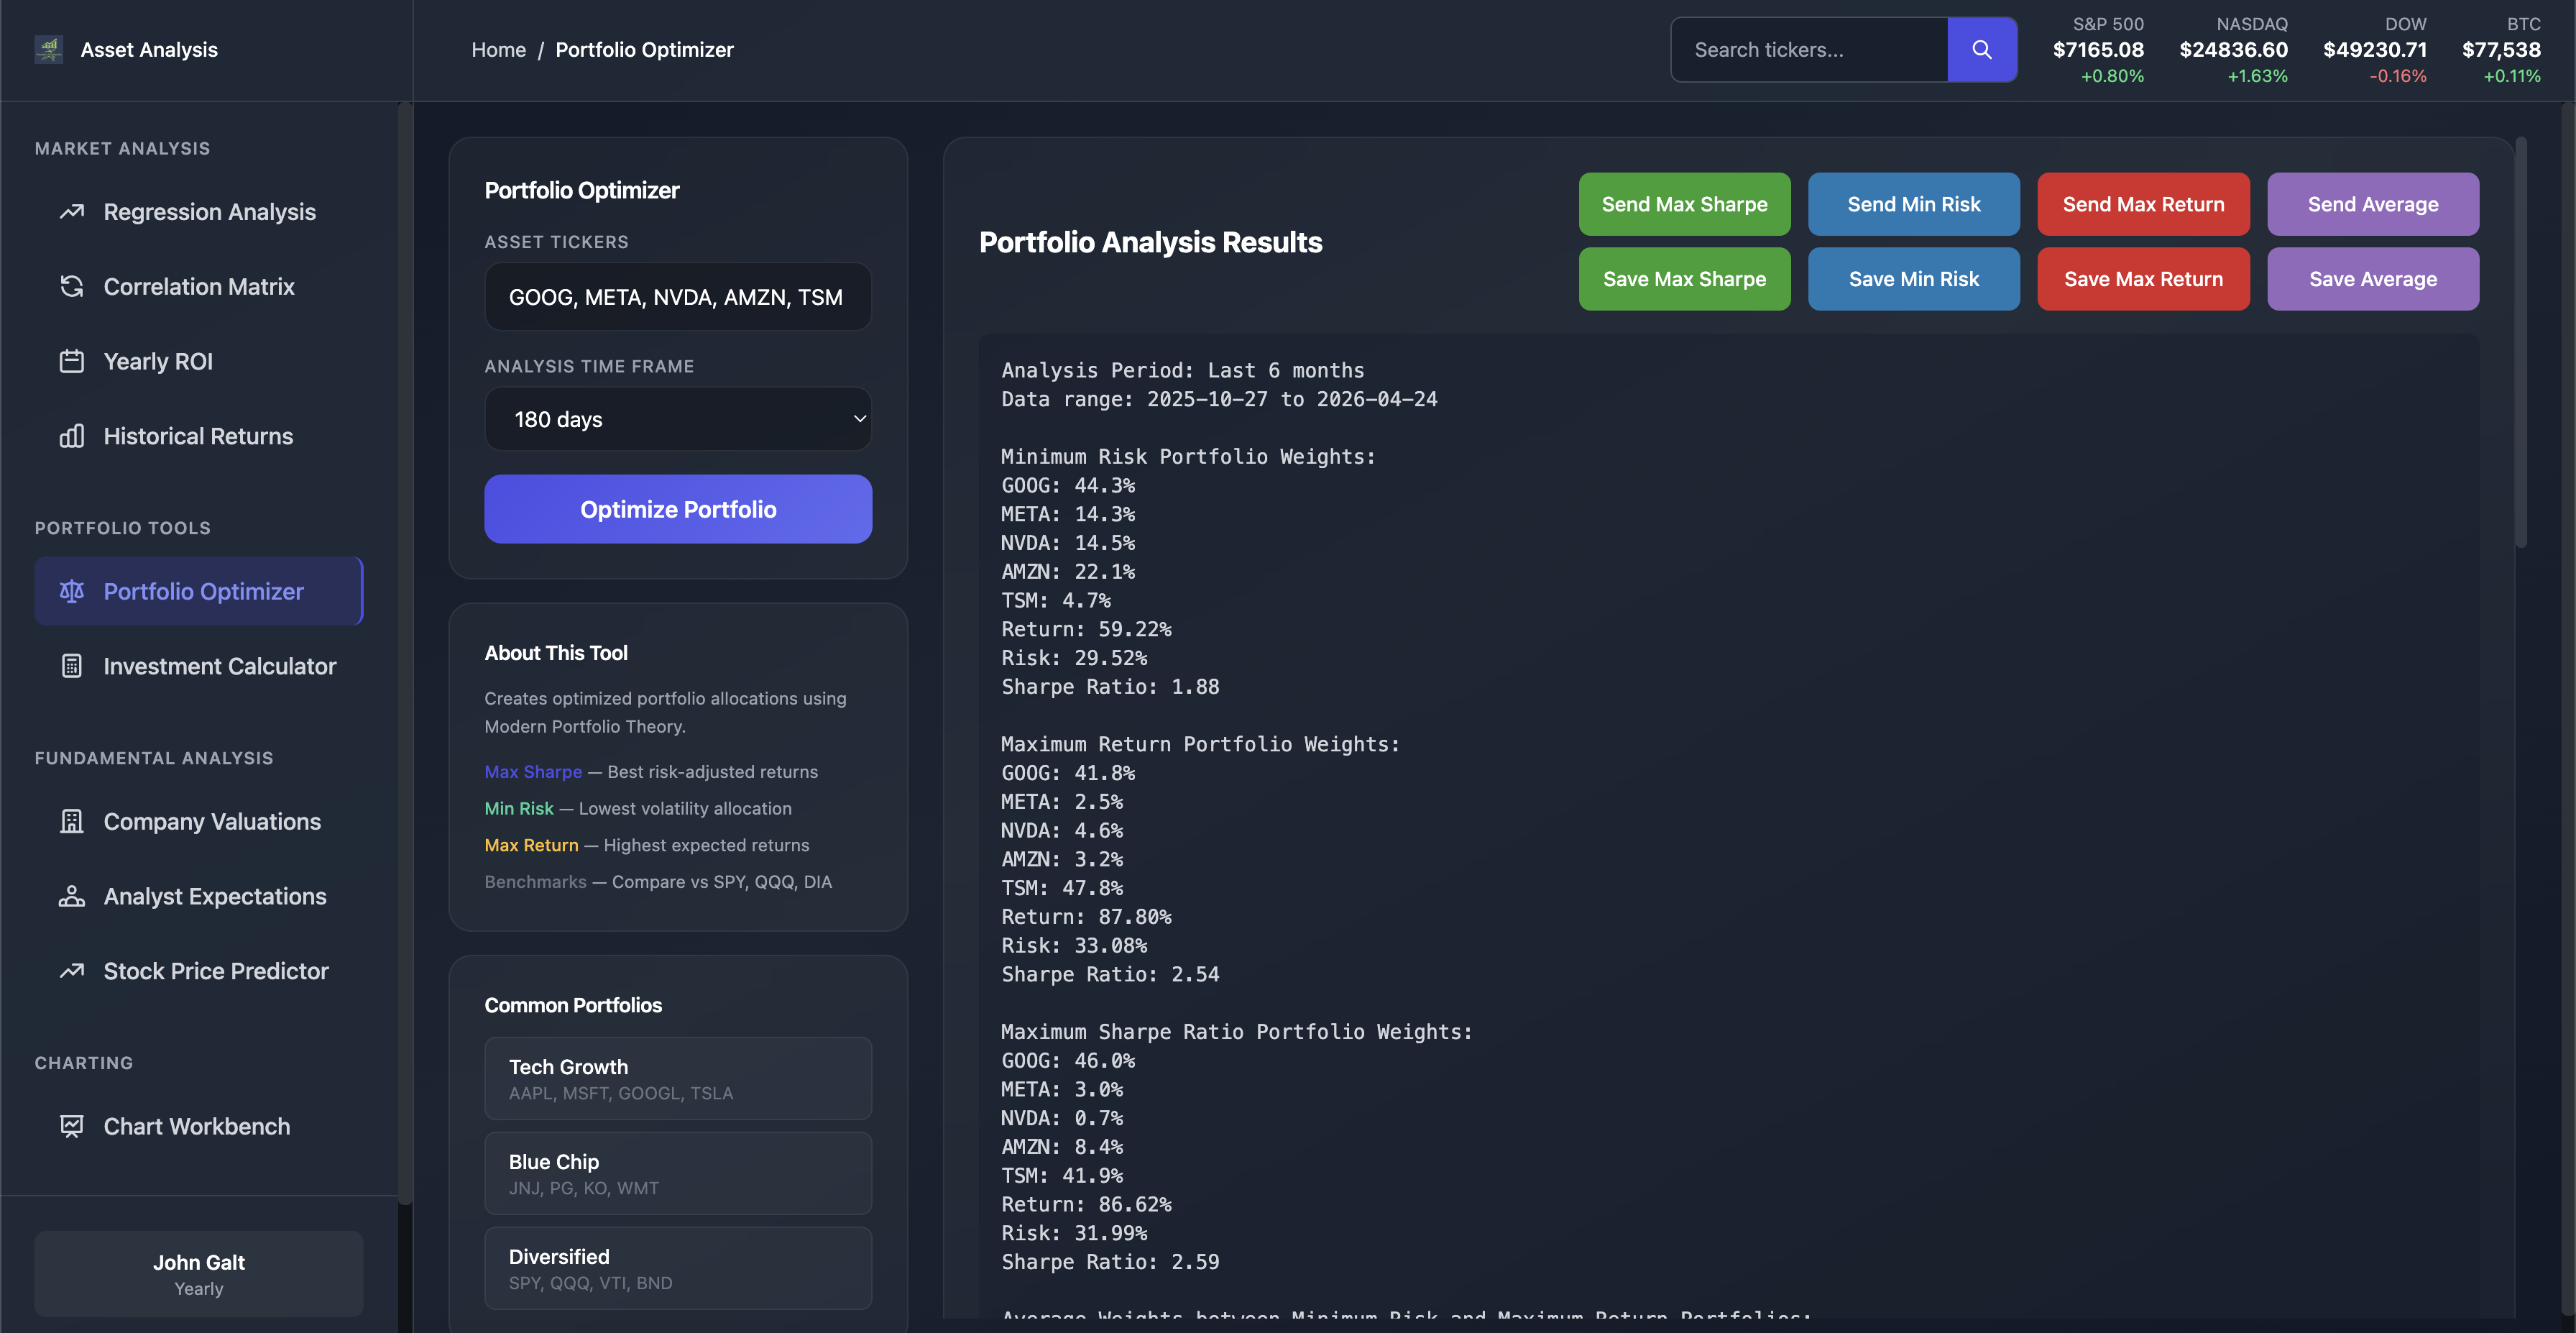
Sharpe, risk, and return trade-offs with Monte Carlo simulation, efficient frontier intuition, and weight outputs you can take back to the dashboard.
Open optimizer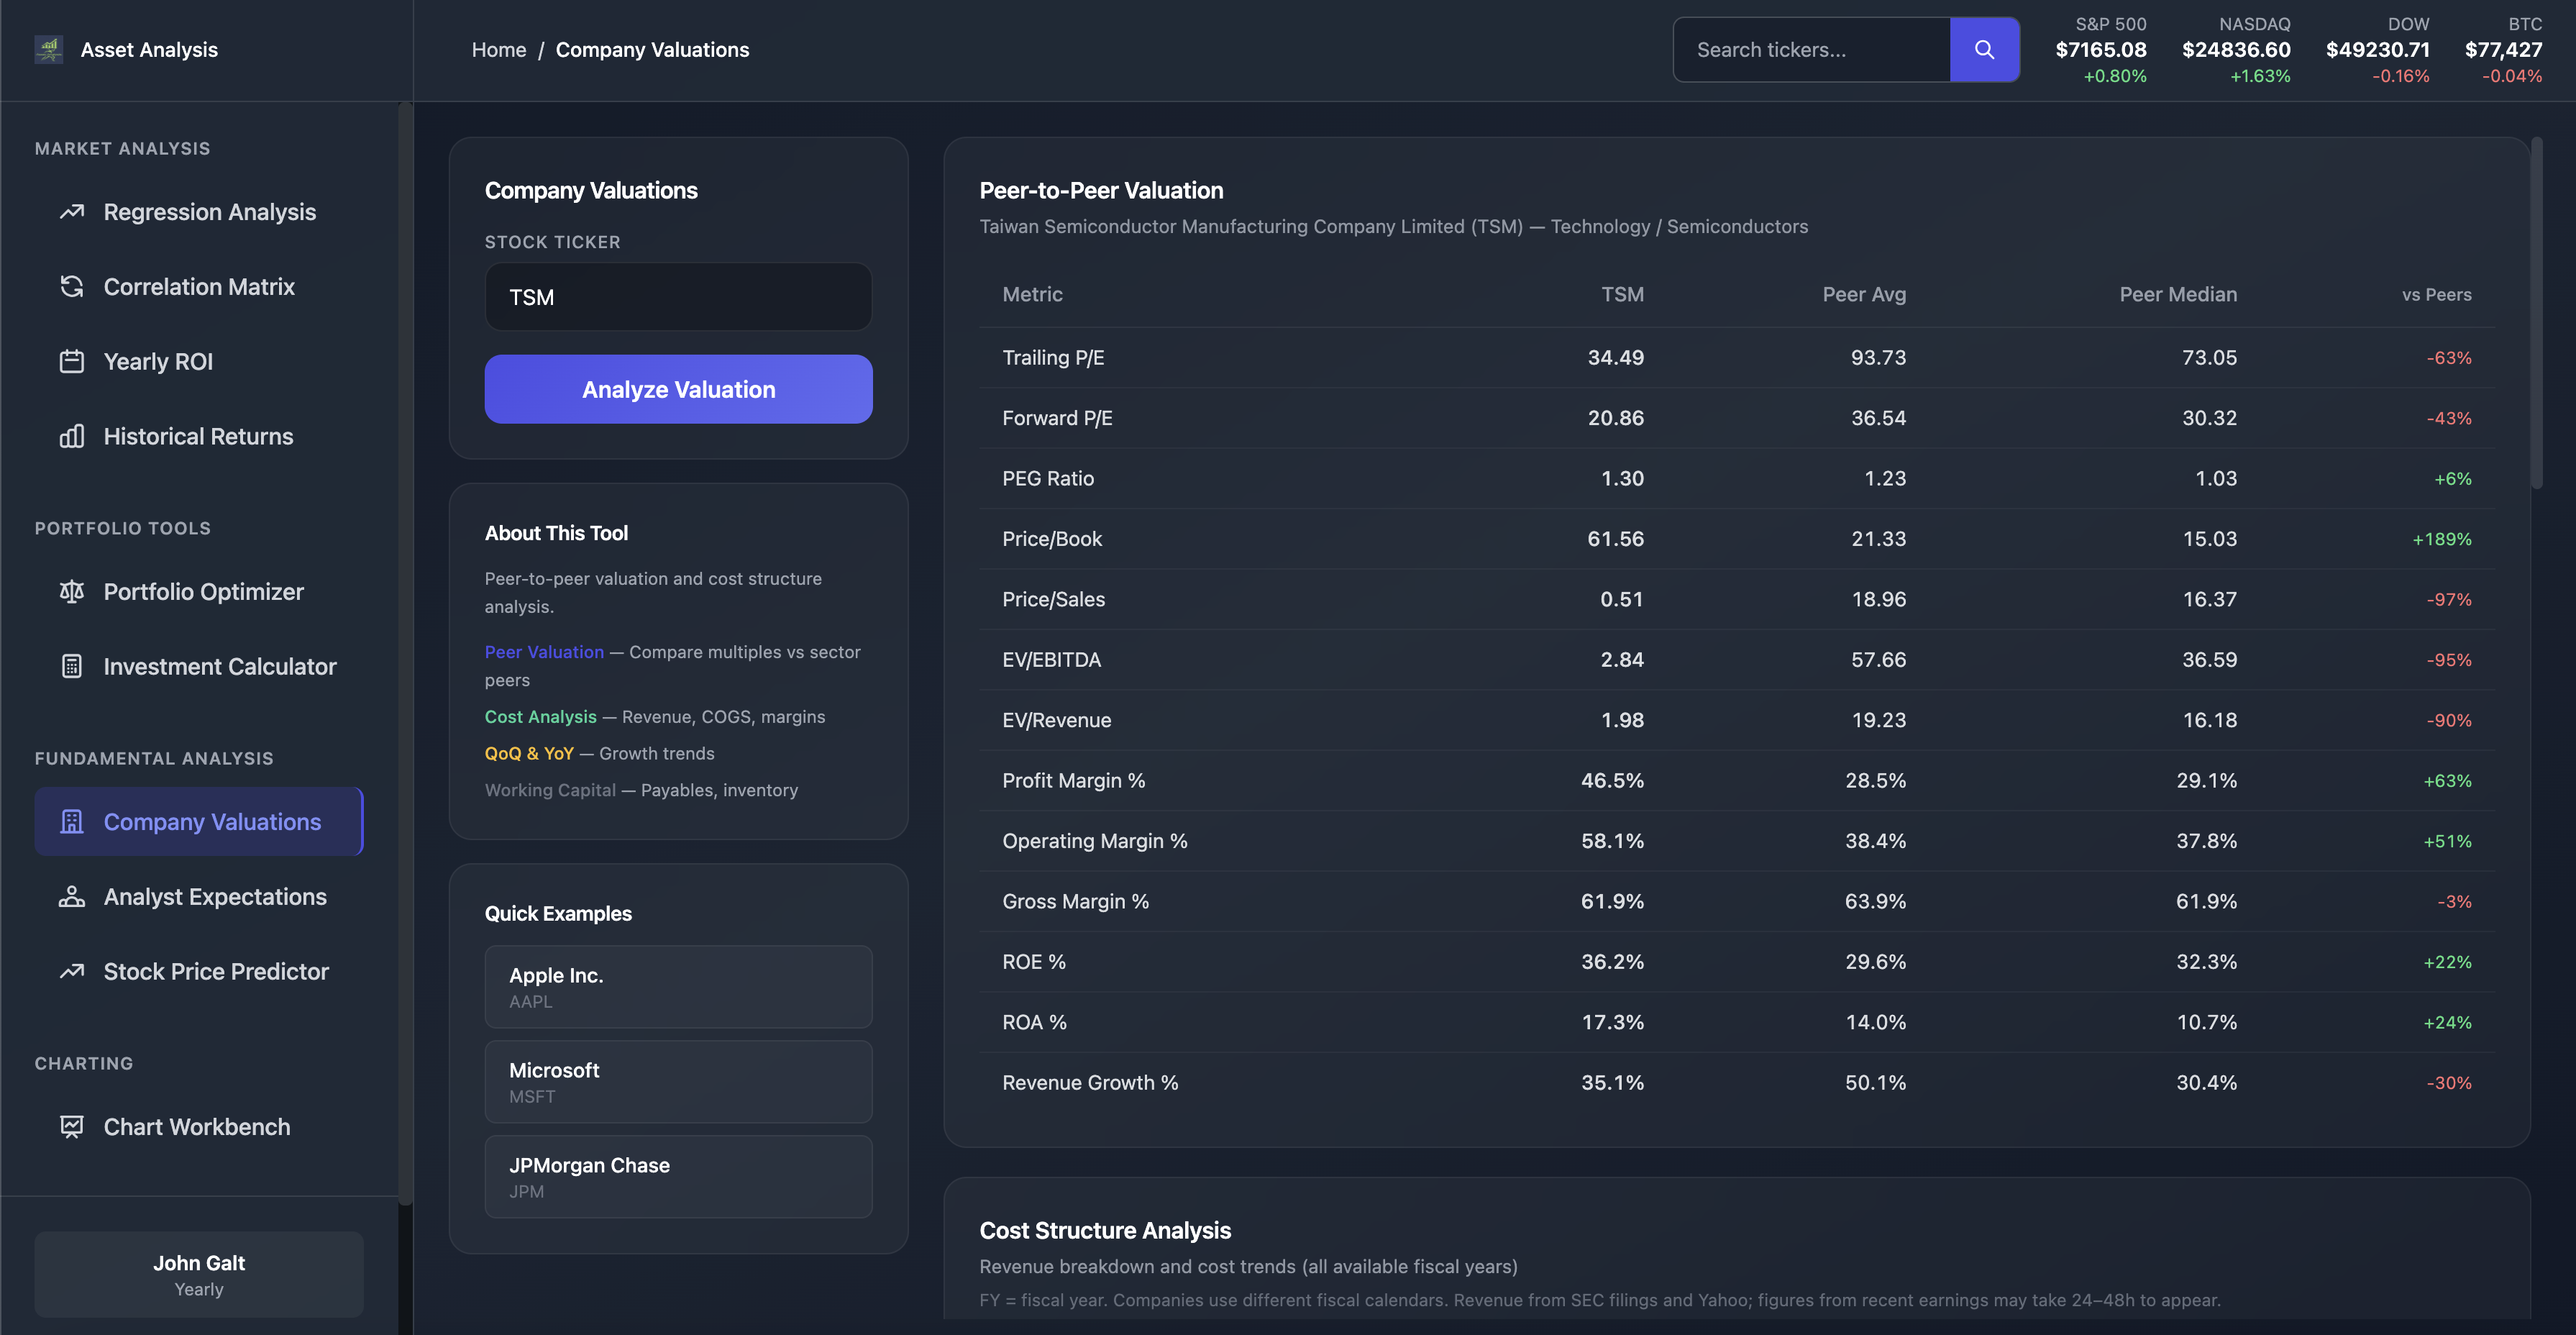
Multiples, yields, and comparative metrics in a terminal-friendly table — a fast pass on whether a name is stretched vs peers.
Open valuations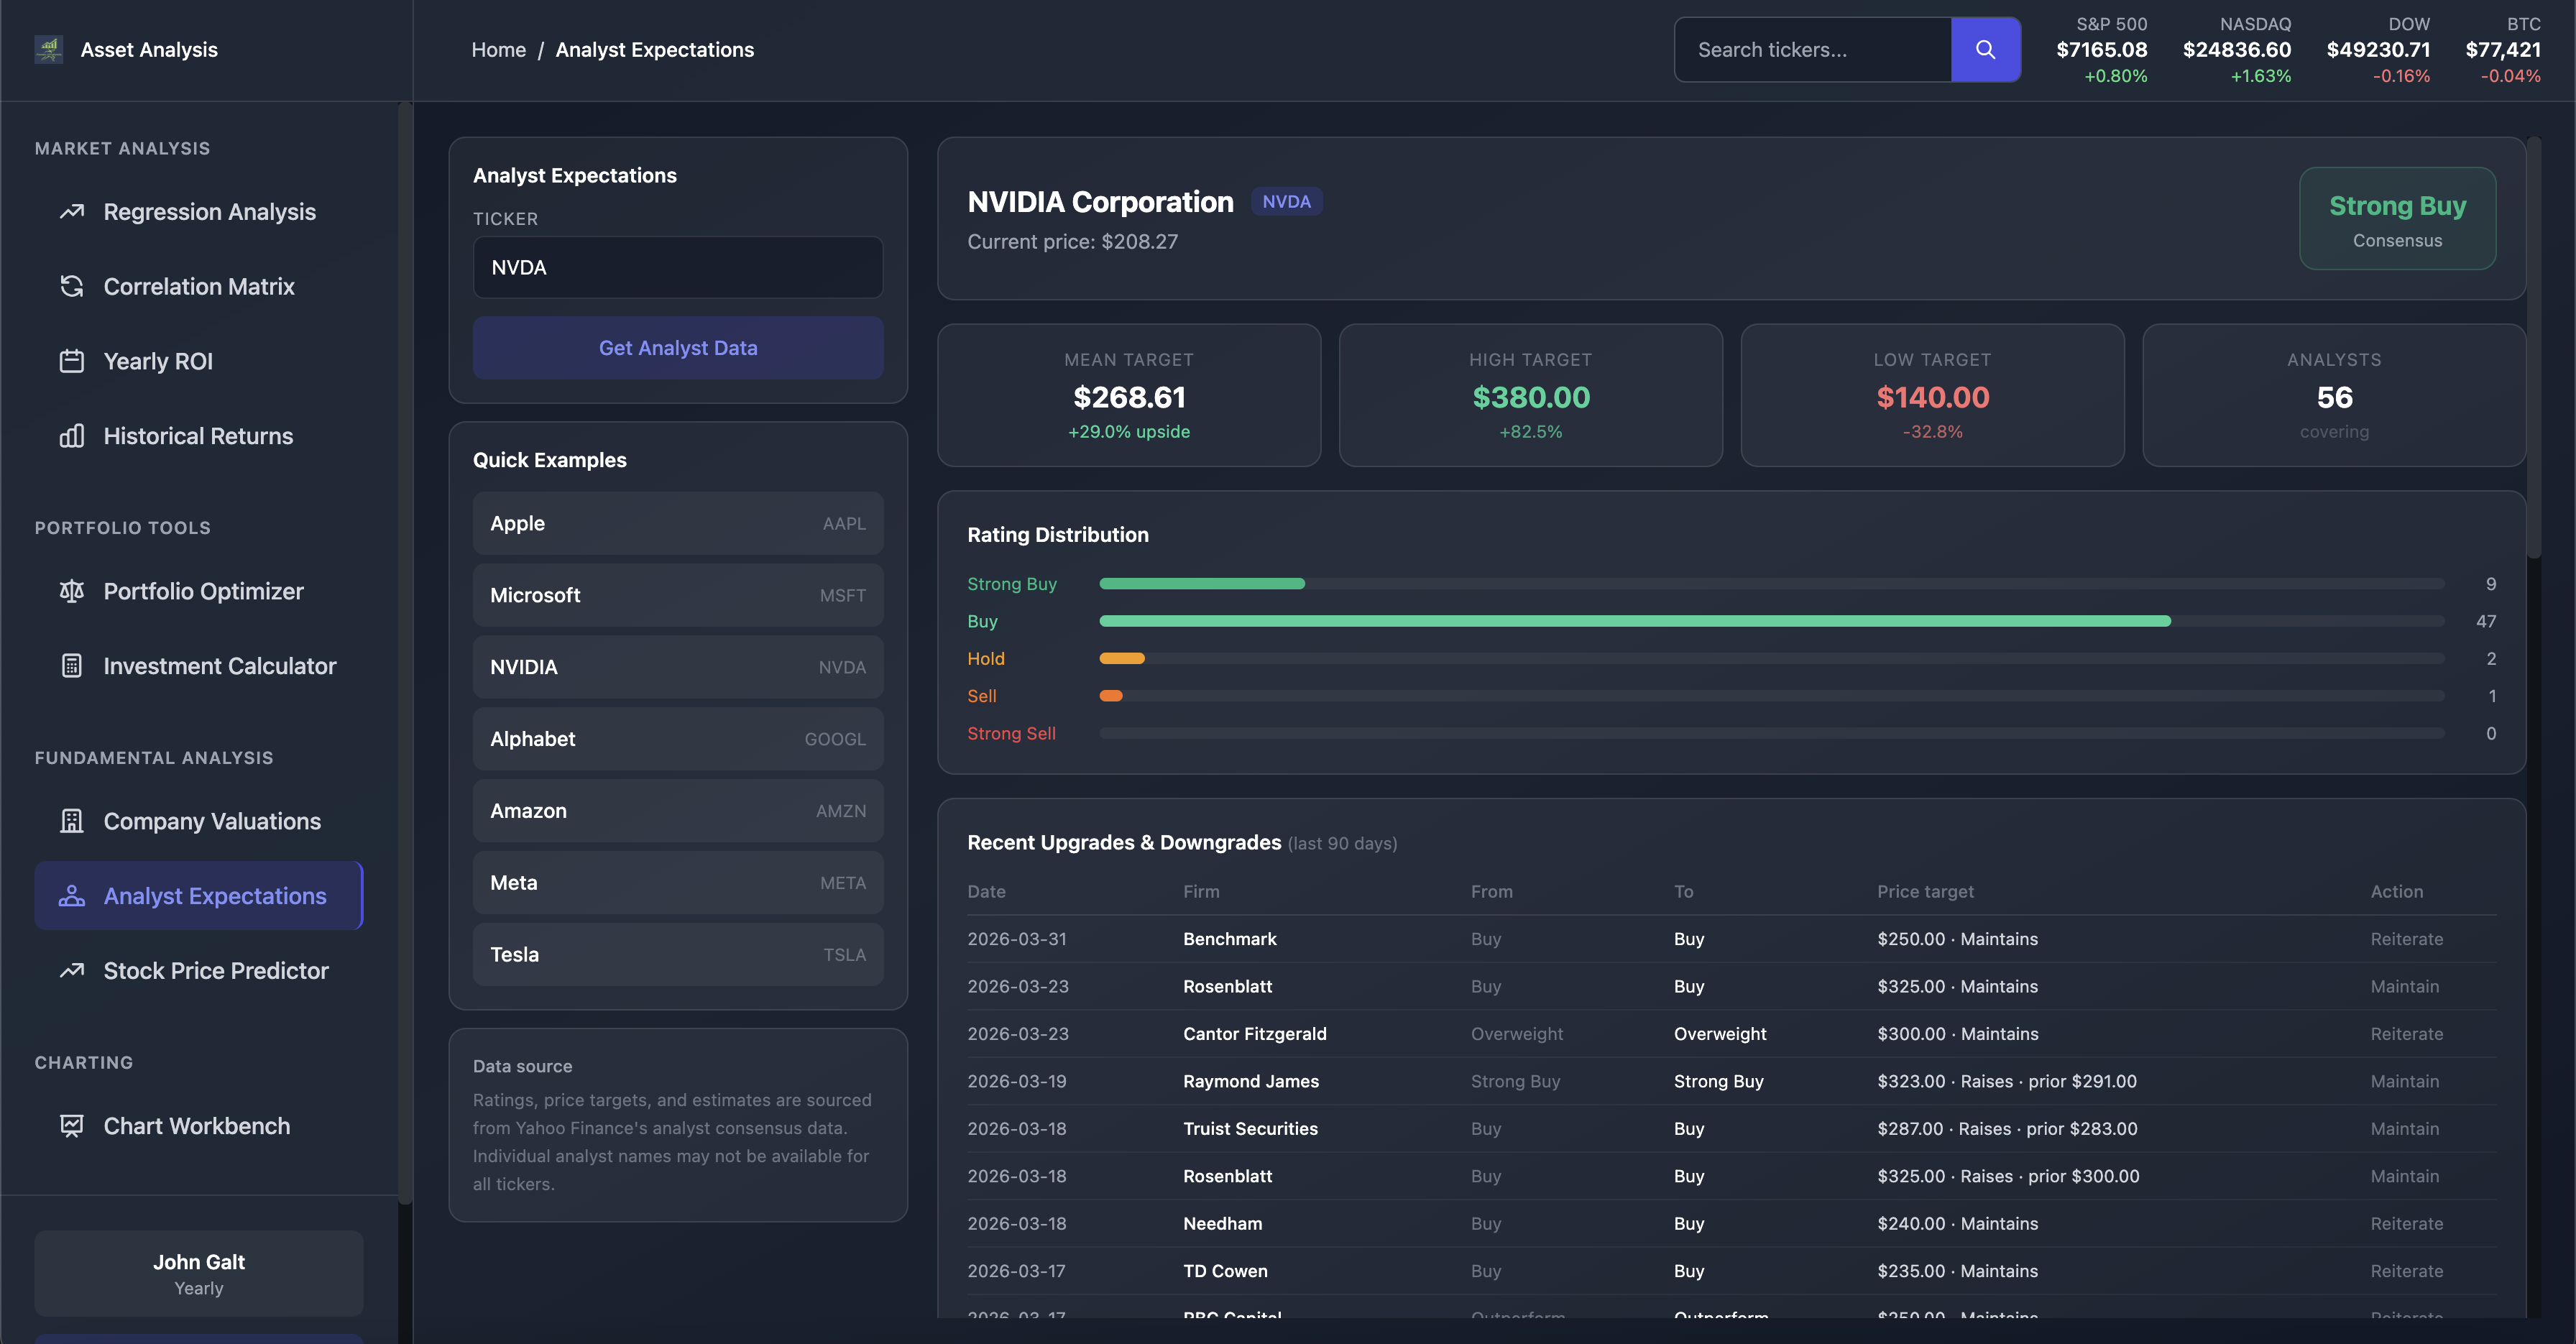
Analyst expectations with earnings history, forecast accuracy, and trendlines — a quick check on whether a name is undervalued or overvalued.
Open analyst expectations & stock predictorAny questions? Contact support@assetanalysis.info.